Statistics is the science of designing studies or experiments, collecting data, and
An Introduction to Statistical Methods & Analysis by R. Lyman Ott and Michael Longnecker
modeling/analyzing data for the purpose of decision making and scientific discovery when the available information is both limited and variable. That is, statistics is
the science of Learning from Data
We are starting this basic study of statistics in the journey of “Log Analytics and Anomaly Detection” learning plan we discussed in the previous post. Based on the above definition and a little more research on the definitions from various sources, we can understand that statistics is –
Statistics is the science of collecting, organizing, analyzing, and interpreting data to make informed decisions. Below diagram represents the steps or phases in the study of statistics.
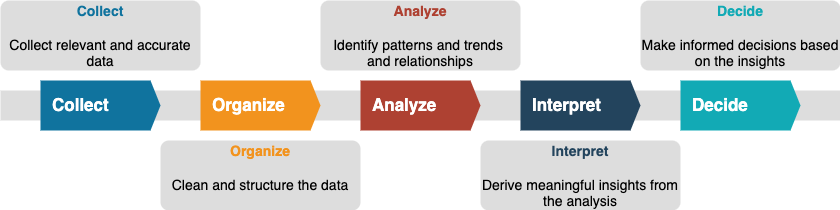
Collect
Data collection is the foundation of any successful data science project. Without good-quality data, even the most advanced algorithms and analytical techniques will fall short. For programmers and data science beginners, understanding how to gather, classify, and prepare data is crucial. Whether you’re analyzing logs, databases, or survey results, the methods you choose will determine the accuracy and usefulness of your findings. In this blog, we’ll explore the basics of data collection—what it involves, why it matters, and how to do it effectively.
At its core, data collection is the process of gathering information to analyze and draw conclusions. It’s the first and most crucial step in any statistical or data science workflow. The quality and accuracy of your analysis depend heavily on how you collect data.
Before diving into collection methods, it’s essential to understand the two main types of data:
- Quantitative Data:
- Numeric and measurable (e.g., sales figures, response times).
- Examples: Average page load time, CPU usage logs.
- Qualitative Data:
- Descriptive and categorical (e.g., user feedback, product reviews).
- Examples: Comments in customer surveys, log severity levels (info, warning, error).
How to collect the data? The method of data collection depends on the goals of your project. Here are some common approaches:
- Surveys and Questionnaires: Ideal for gathering opinions, trends, or user feedback. For example, a survey might be used to understand voting patterns in an election or customer satisfaction for a product.
- Logs and Machine Data: Automatically generated logs are invaluable for understanding system performance and detecting anomalies.
- Databases and Reports: Existing databases and reports provide rich secondary data for analysis.
- APIs and Web Scraping: Programmatic methods like APIs or web scraping can collect data from external sources.
Organize
Once the data is collected, organizing it effectively is the next critical step. Data organization involves structuring raw data into a format that is clean, consistent, and ready for analysis.
Key activities in data organization are as below:
- Data Cleaning
- Remove or handle missing, duplicate, or irrelevant entries.
- Standardize formats (e.g., date formats, numerical precision).
- Example: Converting all timestamps to UTC for consistency.
- Data Structuring
- Arrange data into tables, files, or databases for easy access.
- Use relational structures like rows and columns in SQL or hierarchical formats in JSON.
- Example: Organizing web scraped data into structured tables with columns like
Date,Source, andValue.
- Indexing and Sorting
- Use indexes to speed up data retrieval.
- Sort data for efficient querying or visualization.
- Example: Indexing logs by timestamp to quickly fetch data for a specific period.
- Data Integration
- Merge data from multiple sources into a cohesive dataset.
- Handle discrepancies like different naming conventions or units.
- Example: Combining sales data from two regions into a unified report.
- Metadata Addition
- Add metadata to describe the data (e.g., source, collection date).
- Example: Tagging logs with server names and geolocations.
Data organization transforms raw, unstructured data into a clean and analyzable format, setting the stage for insightful analysis. By combining effective collection methods with robust organizational practices, you can ensure your data science projects are built on a solid foundation.
Analyze
The Analyze phase in statistics involves processing and interpreting collected and organized data to extract meaningful insights. This step uses statistical methods to summarize the data, identify patterns, test hypotheses, and establish relationships between variables. Here’s a breakdown tailored for programmers and data science beginners:
Statistical analysis applies mathematical techniques to examine, interpret, and summarize data. It helps in understanding trends, validating assumptions, and making predictions or decisions.
Descriptive Statistics:
- Objective: Summarize and describe the main features of the data.
- Methods:
- Measures of Central Tendency: Mean, median, mode.
- Example: The average response time of a server.
- Measures of Dispersion: Range, variance, standard deviation.
- Example: Analyzing the variability in daily error rates.
- Visualization: Histograms, boxplots, pie charts.
- Example: Plotting the frequency of HTTP error codes.
- Measures of Central Tendency: Mean, median, mode.
Inferential Statistics:
- Objective: Make predictions or generalizations about a population based on sample data.
- Methods:
- Hypothesis Testing: Determining if observed differences are statistically significant.
- Example: Testing if a new system update reduces processing time.
- Confidence Intervals: Estimating the range of possible values for a parameter.
- Example: Predicting monthly traffic with a 95% confidence interval.
- Regression Analysis: Identifying relationships between variables.
- Example: Correlating user activity and server load.
- Hypothesis Testing: Determining if observed differences are statistically significant.
Exploratory Data Analysis (EDA):
- Objective: Uncover patterns, trends, and relationships within the data.
- Techniques:
- Scatterplots for correlation.
- Pair plots for multi-variable analysis.
- Heatmaps for visualizing relationships in data matrices.
- Example: Using a scatterplot to determine the relationship between response time and CPU usage.
Predictive Analysis:
- Objective: Use statistical models to forecast future outcomes.
- Techniques:
- Time-series analysis (e.g., ARIMA).
- Predictive regression models.
- Example: Forecasting system downtime based on historical error trends.
Interpret
Data interpretation is the phase where the results of analysis are translated into meaningful insights. It bridges the gap between raw data and actionable conclusions, enabling decision-making based on evidence.
Key activities in data interpretation include:
- Contextualizing Results:
- Relate findings to the original goals or questions.
- Example: If analysis shows increased error rates during peak hours, interpret it as a sign of server overloading.
- Explaining Patterns and Trends:
- Describe what the data reveals about behavior or performance.
- Example: Interpreting a correlation between high CPU usage and slower response times.
- Identifying Implications:
- Understand the impact of findings on the system, business, or study.
- Example: Highlighting how traffic spikes could require infrastructure scaling.
- Evaluating Significance:
- Assess whether observed trends or patterns are statistically and practically meaningful.
- Example: Interpreting a p-value to determine if a performance improvement is significant.
- Communicating Insights:
- Present findings in an understandable format for stakeholders.
- Tools: Dashboards, reports, visual summaries.
- Example: Using a dashboard to show trends in server performance metrics.
Data interpretation is where the true value of data science emerges. By translating analytical results into actionable insights, you enable data-driven decisions that can improve systems, processes, and outcomes.
Decide
Decision-making is the final phase in the statistical study workflow. It involves using insights derived from analysis and interpretation to make informed choices, implement strategies, or recommend actions.
Key activities in decision-making include:
- Action Planning:
- Develop strategies based on insights.
- Example: Scaling server resources during peak hours to avoid downtime.
- Predictive Decision-Making:
- Use predictive models to forecast outcomes and guide actions.
- Example: Adjusting marketing campaigns based on predicted user behavior.
- Optimization:
- Improve processes or systems using insights.
- Example: Optimizing database queries to reduce response times.
- Risk Assessment:
- Evaluate the potential risks and benefits of decisions.
- Example: Assessing the risk of deploying a new feature during peak traffic periods.
- Implementation and Monitoring:
- Execute decisions and monitor their impact.
- Example: Launching a new product feature and tracking user engagement metrics.
Note: Most of the examples in this blog post are related to logs and other information technology related data, as our goal is to understand statistics to move on to data science for log analysis.
Next we will understand few basic statistics terminology

[…] Understand statistical methods and log structure.Read: Statistics Basics […]