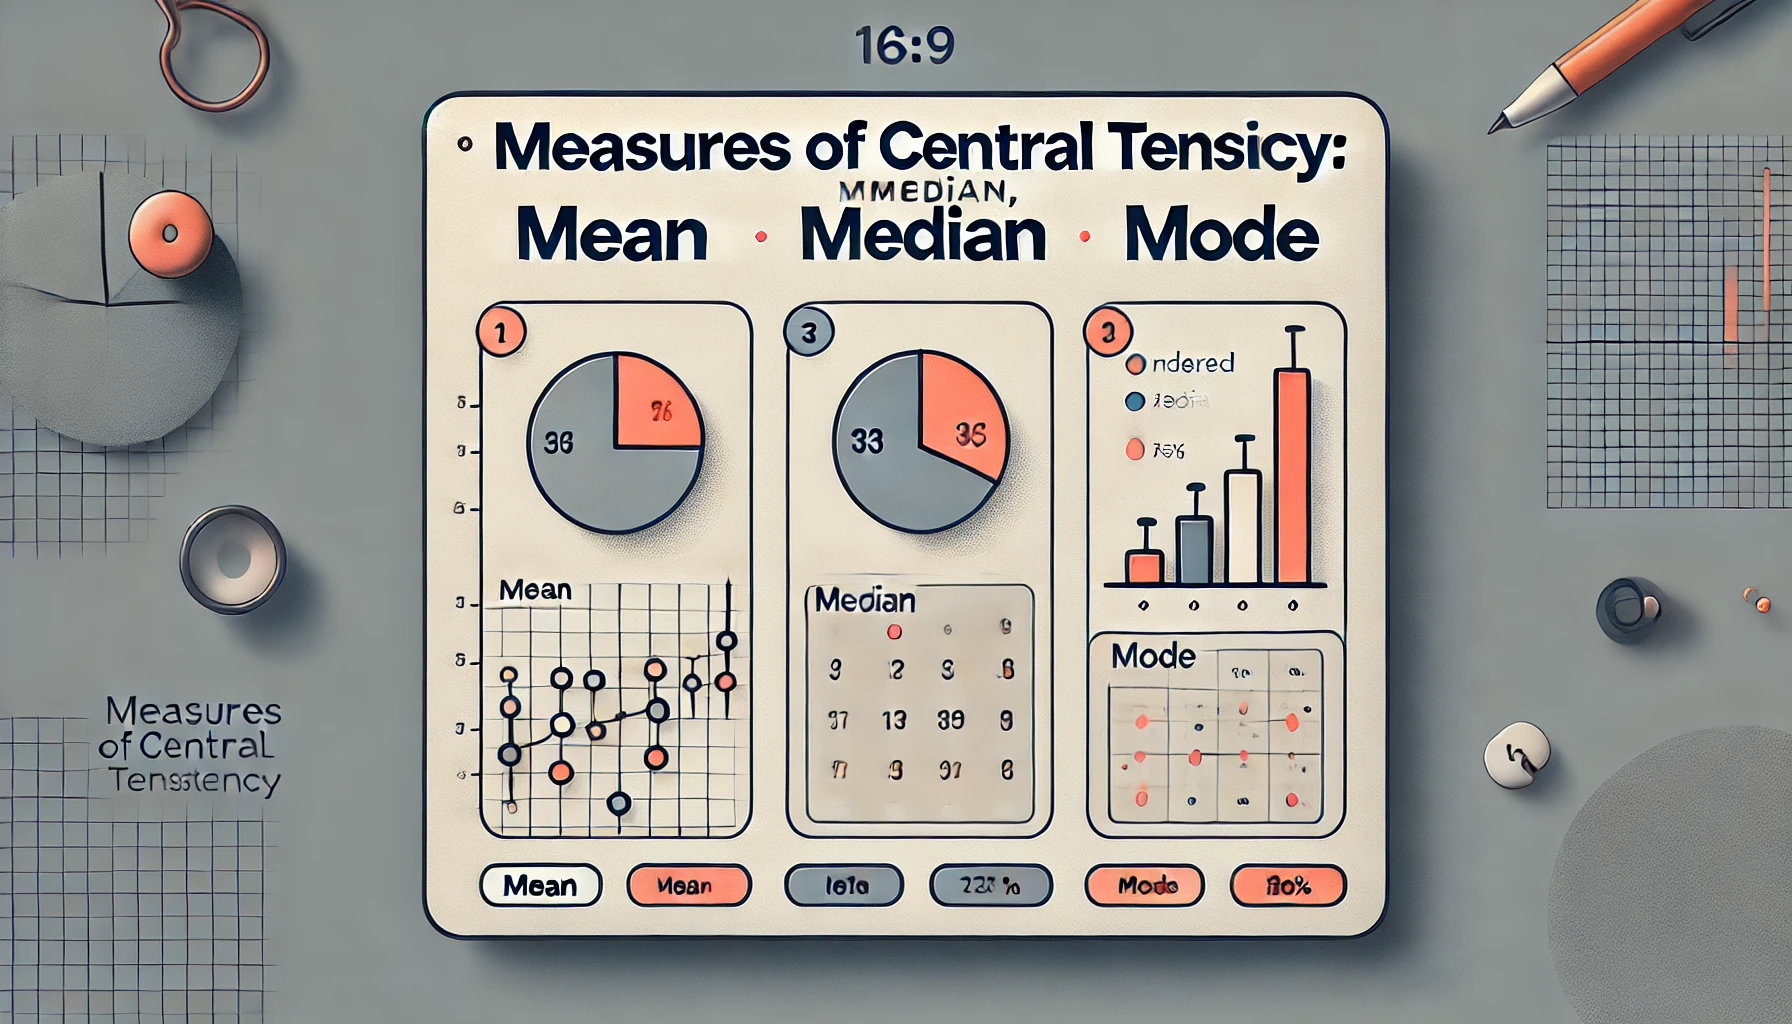
Measures of central tendency are fundamental concepts in statistics that summarize a dataset into a single representative value. These measures provide insights into the central point of a dataset and are widely used in various fields for analysis and decision-making.
What are the Measures of Central Tendency?
- Mean: Also known as the average, the mean is calculated by summing all the values in a dataset and dividing by the number of values. It is the most commonly used measure of central tendency.
- Median: The median is the middle value in a dataset when it is ordered from smallest to largest. If there is an even number of values, the median is the average of the two middle numbers.
- Mode: The mode is the most frequently occurring value in a dataset. A dataset may have one mode, more than one mode, or no mode at all if all values occur with the same frequency.
Purpose of Measures of Central Tendency
The primary purpose of these measures is to summarize a large dataset into a single value that represents the data’s central point. This makes it easier to:
- Compare datasets.
- Identify patterns or trends.
- Make informed decisions.
Examples of Measures of Central Tendency in Action
Example 1: Daily Life of an Average Family
Scenario: A family tracks their monthly expenses to better manage their budget. The recorded monthly expenses (in USD) for the past six months are: $2000, $2200, $2100, $2300, $2000, $2400$
- Mean: The mean shows the average monthly expenditure is approximately $2166.67.
- Median: Arrange values: $2000, 2000, 2100, 2200, 2300, 2400$ The median indicates that half the months had expenses below $2150, and the other half had expenses above it.
- Mode: The most frequently occurring value is $2000.
Usefulness:
- The mean helps the family understand their typical expenditure.
- The median is less affected by any unusually high or low expenses.
- The mode highlights the most common monthly expense value, which could indicate a steady spending pattern.
Example 2: IT Operations Scenario
Scenario: An enterprise monitors the time (in minutes) taken to resolve incidents. The times recorded for 10 incidents are: 30, 45, 30, 60, 75, 45, 30, 90, 120, 60
- Mean: The mean resolution time is 58.5 minutes.
- Median: Arrange values: $30, 30, 30, 45, 45, 60, 60, 75, 90, 120$ The median indicates half the incidents were resolved in less than 52.5 minutes.
- Mode: The most frequent value is $30.
Usefulness:
- The mean helps identify the overall average resolution time.
- The median helps IT managers understand the typical resolution time without being skewed by unusually long incidents.
- The mode shows the most common resolution time, highlighting consistency in operations.
Example 3: Country Perspective
Scenario: A country collects data on the monthly income (in USD) of citizens in a particular region. The incomes are: $1500, $2000, $1500, $3000, $2500, $1500, $4000, $3500, $1500, $4500$
- Mean: The mean monthly income is $2550.
- Median: Arrange values: $1500, 1500, 1500, 1500, 2000, 2500, 3000, 3500, 4000, 4500$ The median income is $2000.
- Mode: The most frequent value is $1500.
Usefulness:
- The mean income provides an average economic perspective.
- The median income represents the central income level, highlighting the economic position of the majority.
- The mode indicates the most common income level, useful for identifying income clusters.
Conclusion
Understanding the measures of central tendency—mean, median, and mode—is essential for interpreting and summarizing data effectively. Whether managing a family budget, optimizing IT operations, or analyzing a country’s economic health, these measures provide valuable insights and support informed decision-making.